Unlock real-time, data-driven decision-making across Finance, Sales, and Marketing with our customized Power BI solutions.
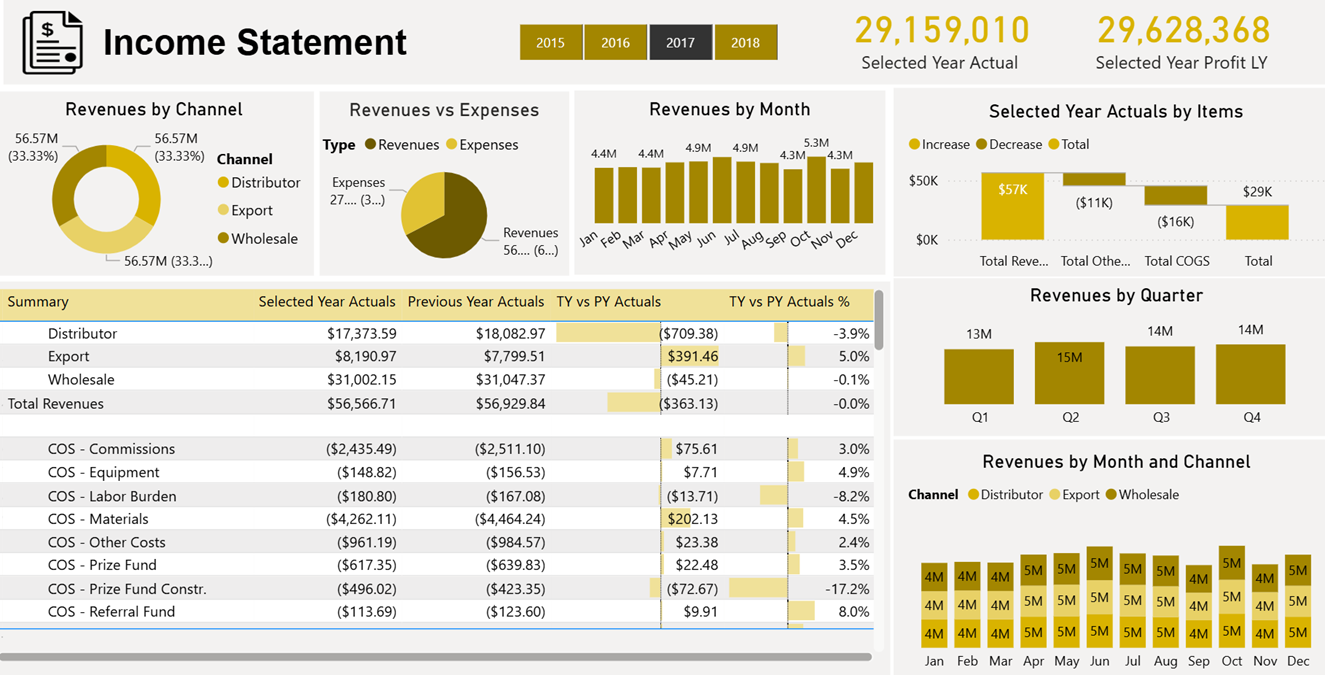
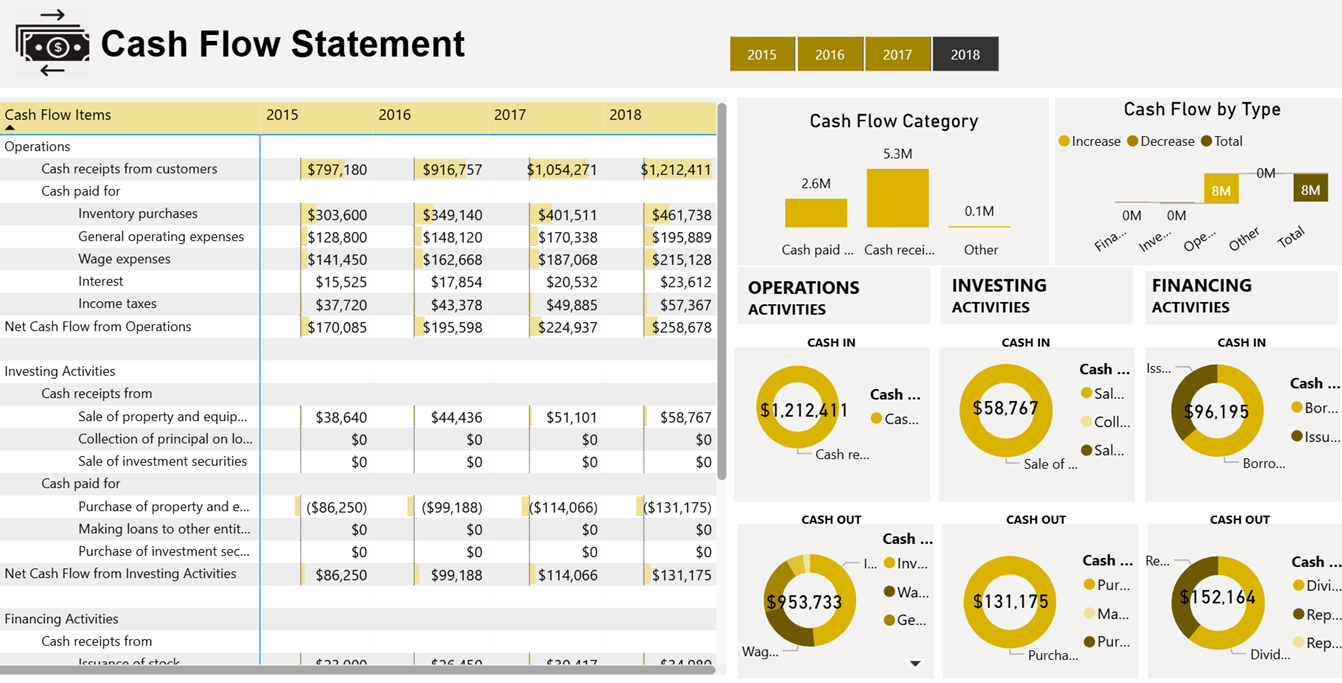
The dashboard visualizes monthly trends for income, overheads, and net income clearly and effectively. KPIs like net income, profit trends, and expenses trends help monitor financial health and inform decisions.
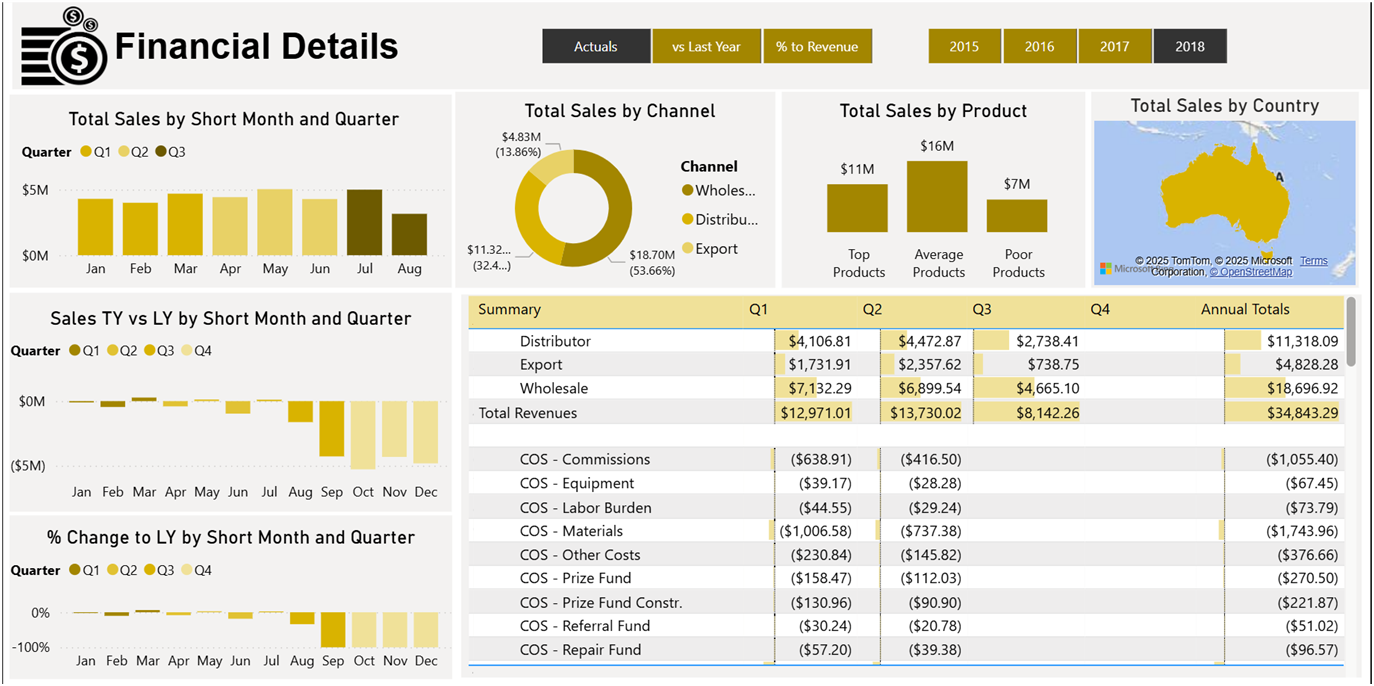
Income and overheads can be broken down by account with filtering by client and class for detailed insights.
Real time / periodic top contributing funnels help management to formulate strategies, keep a check on significant changes, on tips with key communicating points.
Visualize total sales by channel, total sales by product, and total sales by country, along with detailed tables for Cost of Sales (COS) and Total Revenues.
Track Total Sales by Short Month and Quarter, Sales TY vs LY by Short Month and Quarter, and % Change to LY for in-depth performance review.
Dashboard visualizes assets, liabilities, and equity trends for a clear financial position overview.
Users can filter by date, class, and client for tailored analysis. Includes breakdowns by account groups and specific transactions driving each account's value.
L2 details to make users enhance control and act on exceptions instead of formulating data.
Dashboard visualizes outstanding invoices against which collections are due along with the due ageing. Eases alignment of actuality vs. business expectations.
Dashboard visualizes outstanding payables along with the due ageing and historical trend.
The dashboard categorizes cash flow into operating, investing, and financing activities for clear financial insight. Specific accounts within each category provide detailed insights into cash inflows and outflows.
The dashboard highlights total cash increase or decrease, helping businesses monitor liquidity effectively. Interactive views support better cash management and accurate financial forecasting.
The dashboard displays total revenue and breaks it down by payment terms, location, salesperson group, and region. It tracks revenue and margin by salesperson and compares current revenue against targets for effective management.
Highlights trends and variances in sales to enable improved resource allocation, forecasting, and decision-making. Features allow drilling down into specific data points for deeper analysis.
The dashboard tracks key metrics such as ad spend, impressions, CPC, and CTR to evaluate campaign success.
Campaigns are assessed based on specific objectives like brand awareness or lead generation for accurate insights. Visualized data enables marketers to optimize budgets, identify top campaigns, and improve ROI effectively.
"Kinnari, with CleanBooks Services, has been a key part of growth of our Organization from the start. We can always count on Team CleanBooks to handle any task requested of them. Our books are kept up to date, without me needing to be involved. It is great to have them."
Canonizer.com LLC
"I have worked with many Indian companies, but none have come close to the quality of service provided by CleanBooks Accounting. They are smart, efficient, prompt, courteous and understanding of all our company's Accounting needs. I can't recommend them enough. A rare gem!"
HGID Online
"Our books are kept up to date, without me needing to be involved. It is great to have them."
Business Owner
"I can't recommend them enough. A rare gem!"
Business Owner